I don’t know who Amar Bhide (apologies for not being able to insert an accent over the “e” in his last name) is, but Edmund Phelps is certainly an eminent economist and a deserving recipient of the 2006 Nobel Prize in economics. Unfortunately, Professor Phelps attached his name to an op-ed in Wednesday’s Wall Street Journal, co-authored with Bhide, consisting of little more than a sustained, but disjointed, rant about the Fed and central banking. I am only going to discuss that first part of the op-ed that touches on the monetary theory of increasing the money supply through open-market operations, and about the effect of that increase on inflation and inflation expectations. Bhide and Phelps not only get the theory wrong, they seem amazingly oblivious to well-known facts that flatly contradict their assertions about monetary policy since 2008. Let’s join them in their second paragraph.
Monetary policy might focus on the manageable task of keeping expectations of inflation on an even keel—an idea of Mr. Phelps’s [yes that same Mr. Phelps whose name appears as a co-author] in 1967 that was long influential. That would leave businesses and other players to determine the pace of recovery from a recession or of pullback from a boom.
Nevertheless, in late 2008 the Fed began its policy of “quantitative easing”—repeated purchases of billions in Treasury debt—aimed at speeding recovery. “QE2” followed in late 2010 and “QE3” in autumn 2012.
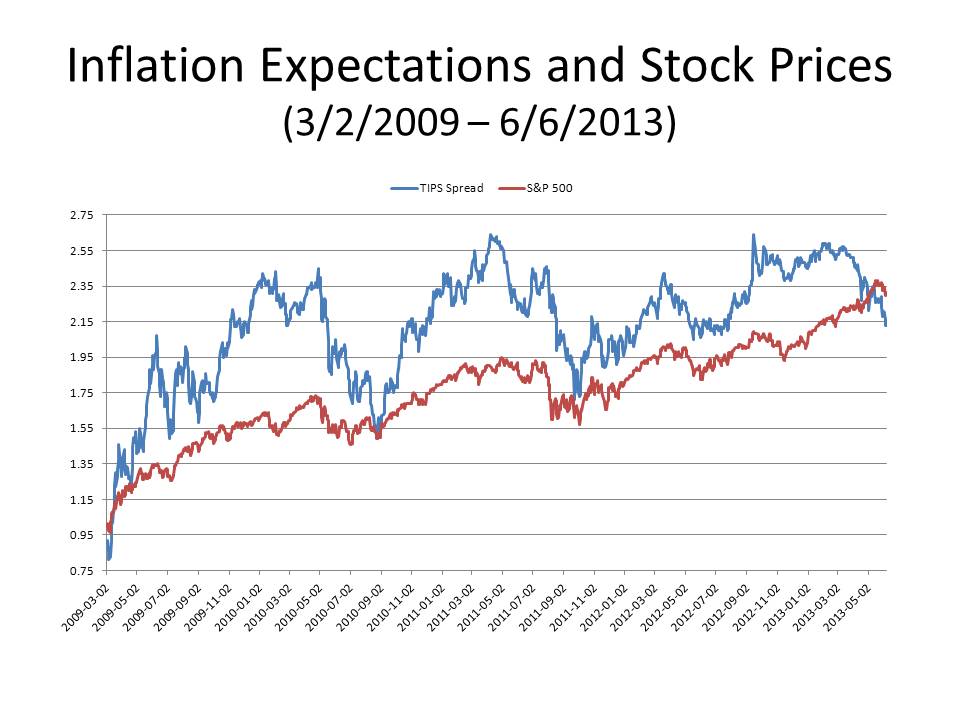
One can’t help wondering what planet Bhide and Phelps have been dwelling on these past four years. To begin with, the first QE program was not instituted until March 2009 after the target Fed funds rate had been reduced to 0.25% in December 2008. Despite a nearly zero Fed funds rate, asset prices, which had seemed to stabilize after the September through November crash, began falling sharply again in February, the S&P 500 dropping from 869.89 on February 9 to 676.53 on March 9, a decline of more than 20%, with inflation expectations as approximated, by the TIPS spread, again falling sharply as they had the previous summer and fall.
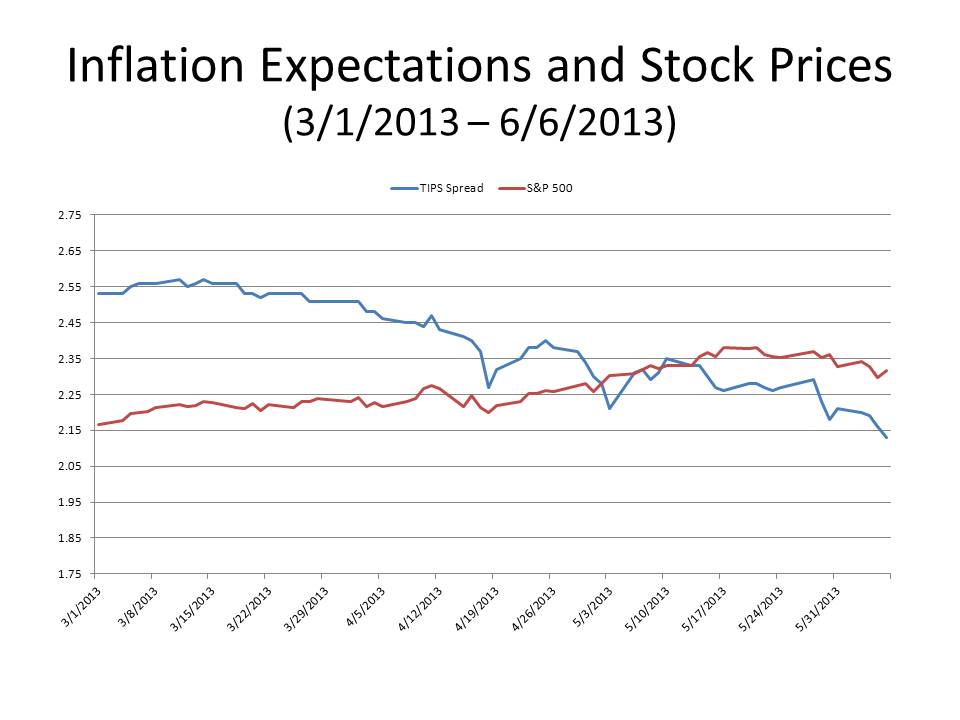
Apart from their confused chronology, their suggestion that the Fed’s various quantitative easings have somehow increased inflation and inflation expectations is absurd. Since 2009, inflation has averaged less than 2% a year – one of the longest periods of low inflation in the entire post-war era. Nor has quantitative easing increased inflation expectations. The TIPS spread and other measures of inflation expectations clearly show that inflation expectations have fluctuated within a narrow range since 2008, but have generally declined overall.
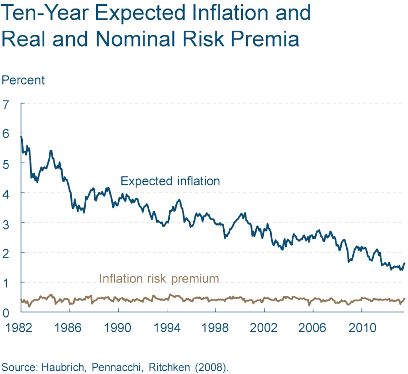
The graph below shows the estimates of the Cleveland Federal Reserve Bank of 10-year inflation expectations since 1982. The chart shows that the latest estimate of expected inflation, 1.65%, is only slightly above its the low point, reached in March, over the past 30 years. Thus expected inflation is now below the 2% target rate that the Fed has set. And to my knowledge Professor Phelps has never advocated targeting an annual inflation rate less than 2%. So I am unable to understand what he is complaining about.
Bhide and Phelps continue:
Fed Chairman Ben Bernanke said in November 2010 that this unprecedented program of sustained monetary easing would lead to “higher stock prices” that “will boost consumer wealth and help increase confidence, which can also spur spending.”
It is doubtful, though, that quantitative easing boosted either wealth or confidence. The late University of Chicago economist Lloyd Metzler argued persuasively years ago that a central-bank purchase, in putting the price level onto a higher path, soon lowers the real value of household wealth—by roughly the amount of the purchase, in his analysis. (People swap bonds for money, then inflation occurs, until the real value of money holdings is back to where it was.)
There are three really serious problems with this passage. First, and most obvious to just about anyone who has not been asleep for the last four years, central-bank purchases have not put the price level on a higher path than it was on before 2008; the rate of inflation has clearly fallen since 2008. Or would Bhide and Phelps have preferred to allow the deflation that briefly took hold in the fall of 2008 to have continued? I don’t think so. But if they aren’t advocating deflation, what exactly is their preferred price level path? Between zero and 1.5% perhaps? Is their complaint that the Fed has allowed inflation to be a half a point too high for the last four years? Good grief.
Second, Bhide and Phelps completely miss the point of the Metzler paper (“Wealth, Saving and the Rate of Interest”), one of the classics of mid-twentieth-century macroeconomics. (And I would just mention as an aside that while Metzler was indeed at the University of Chicago, he was the token Keynesian in the Chicago economics department in 1940s and early 1950s, until his active career was cut short by a brain tumor, which he survived, but with some impairment of his extraordinary intellectual gifts. Metzler’s illness therefore led the department to hire an up-and-coming young Keynesian who had greatly impressed Milton Friedman when he spent a year at Cambridge; his name was Harry Johnson. Unfortunately Friedman and Johnson did not live happily ever after at Chicago.) The point of the Metzler paper was to demonstrate that monetary policy, conducted via open-market operations, could in fact alter the real interest rate. Money, on Metzler’s analysis, is not neutral even in the long run. The conclusion was reached via a comparative-statics exercise, a comparison of two full-employment equilibria — one before and one after the central bank had increased the quantity of money by making open-market purchases.
The motivation for the exercise was that some critics of Keynes, arguing that deflation, at least in principle, could serve as a cure for involuntary unemployment — an idea that Keynes claimed to have refuted — had asserted that, because consumption spending depends not only on income, but on total wealth, deflation, by increasing the real value of the outstanding money stock, would actually make households richer, which would eventually cause households to increase consumption spending enough to restore full employment. Metzler argued that if consumption does indeed depend on total wealth, then, although the classical proposition that deflation could restore full employment would be vindicated, another classical proposition — the invariance of the real rate of interest with respect to the quantity of money — would be violated. So Metzler’s analysis — a comparison of two full-employment equilbria, the first with a lower quantity of money and a higher real interest rate and the second with a higher quantity of money and lower real interest rate – has zero relevance to the post-2008 period, in which the US economy was nowhere near full-employment equilibrium.
Finally, Bhide and Phelps, mischaracterize Metzler’s analysis. Metzler’s analysis depends critically on the proposition that the reduced real interest rate caused by monetary expansion implies an increase in household wealth, thereby leading to increased consumption. It is precisely the attempt to increase consumption that, in Metzler’s analysis, entails an inflationary gap that causes the price level to rise. But even after the increase in the price level, the real value of household assets, contrary to what Bhide and Phelps assert, remains greater than before the monetary expansion, because of a reduced real interest rate. A reduced real interest rate implies an increased real value of the securities retained by households.
Under Metzler’s analysis, therefore, if the starting point is a condition of less than full employment, increasing the quantity of money via open-market operations would tend to increase not only household wealth, but would also increase output and employment relative to the initial condition. So it is also clear that, on Metzler’s analysis, apparently regarded by Bhide and Phelps as authoritative, the problem with Fed policy since 2008 is not that it produced too much inflation, as Bhide and Phelps suggest, but that it produced too little.
If it seems odd that Bhide and Phelps could so totally misread the classic paper whose authority they invoke, just remember this: in the Alice-in-Wonderland world of the Wall Street Journal editorial page, things aren’t always what they seem.
HT: ChargerCarl