UPDATE (October 30 (9:22pm EDST): Commenter BJH correctly finds a basic flaw in my little attempt to infer some causation between Trump’s effect on the peso, the peso’s correlation with the S&P 500 and Trump’s effect on the stock market. The correlation cannot bear the weight I put on it. See my reply to BJH below.
The little swoon in the stock markets on Friday afternoon after FBI Director James Comey announced that the FBI was again investigating Hillary Clinton’s emails coincided with a sharp drop in the Mexican peso, whose value is widely assumed to be a market barometer of the likelihood of Trump’s victory. A lot of people have wondered why the stock market has not evidenced much concern about the prospect of a Trump presidency, notwithstanding his surprising success at, and in, the polls. After all, the market recovered from a rough start at the beginning of 2016 even as Trump was racking up victory after victory over his competitors for the Republican presidential nomination. And even after Trump’s capture of the Republican nomination was seen as inevitable, even though many people did start to panick, the stock markets have been behaving as if they were under heavy sedation.
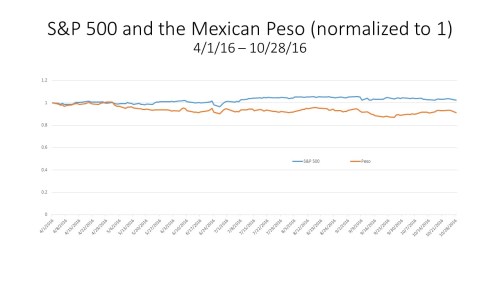
So I thought that I would do a little checking on how the market has been behaving since April, when it had become clear that, barring a miracle, Trump was going to be the Republican nominee for President. Here is a chart showing the movements in the S&P 500 and in the dollar value of the Mexican peso since April 1 (normalized at their April 1 values). The stability in the two indexes is evident. The difference between the high and low values of the S&P 500 has been less than 7 percent; the peso has fluctuated more than the S&P 500, presumably because of Mexico’s extreme vulnerability to Trumpian policies, but the difference between the high and low values of the peso has been only about 12%.
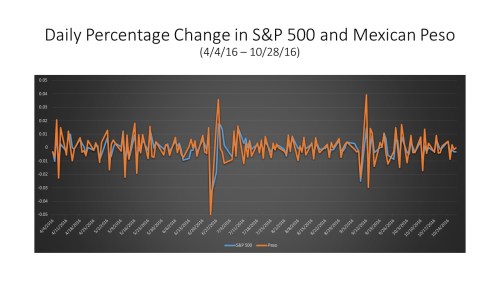
But what happens when you look at the daily changes in the S&P 500 and in the peso? Looking at the changes, rather than the levels, can help identify what is actually moving the markets. Taking the logarithms of the S&P 500 and of the peso (measured in cents) and calculating the daily changes in the logarithms gives the daily percentage change in the two series. The next chart plots the daily percentage changes in the S&P 500 and the peso since April 4. The chart looks pretty remarkable to me; the correlation between changes in the peso and change in the S&P 500 is striking.
A quick regression analysis on excel produces the following result:
∆S&P = 0.0002 + .5∆peso, r-squared = .557,
where ∆S&P is the daily percentage change in the S&P 500 and ∆peso is the daily percentage change in the dollar value of the peso. The t-value on the peso coefficient is 13.5, which, in a regression with only 147 observations, is an unusually high level of statistical significance.
This result says that almost 56% of the observed daily variation in the S&P 500 between April 4 and October 28 of 2016 is accounted for by the observed daily variation in the peso. To be precise, the result doesn’t mean that there is any causal relationship between changes in the value of the peso and changes in the S&P 500. Correlation does not establish causation. It could be the case that the regression is simply reflecting the existence of causal factors that are common to both the Mexican peso and to the S&P 500 and affect both of them at the same time. Now it seems pretty obvious who or what has been the main causal factor affecting the value of the peso, so I leave it as an exercise for readers to identify what factor has been affecting the S&P 500 these past few months, and in which direction.
