In the 2018 midterm elections on two weeks ago on November 6, Democrats gained about 38 seats in the House of Representatives with results for a few seats still incomplete. Polls and special elections for vacancies in the House and Senate and state legislatures indicated that a swing toward the Democrats was likely, raising hopes among Democrats that a blue wave would sweep Democrats into control of the House of Representatives and possibly, despite an unfavorable election map with many more Democratic Senate seats at state than Republican seats, even the Senate.
On election night when results in the Florida Senate and Governor races suddenly swung toward away from the Democrats, the high hopes for a blue wave began to ebb, especially as results from Indiana, Misouri, and South Dakota showed that Democratic incumbent Senators trailing by substantial margins. Other results seemed like a mixed bag, with some Democratic gains, but hardly providing clear signs of a blue wave. The mood was not lifted when the incumbent Democratic Senator from Montana fell behind his Republican challenger and Ted Cruz seemed to be maintaining a slim lead over his charismatic opponent Beto O’Rourke and the Republican candidate for the open Senate seat held by the retiring Jeff Flake of Arizona was leading the Democratic candidate.
As the night wore on, although it seemed that the Democrats would gain a majority in the House of Representatives, estimates of the number of seats gained were only in the high twenties or low thirties, while it appeared that Republicans might gain as many as five Senate Seats. President Trump was able to claim, almost credibly, the next morning at his White House news conference that the election results had been an almost total victory for himself and his party.
It was not till later the next day that it became clear that the Democratic gains in the House would not be just barely enough (23) to gain a majority in the House but would likely be closer to 40 than to 30. The apparent losses of the Montana seat was reversed by late results, and the delayed results from Nevada showed that a Democrat had defeated the Republican incumbent while the Democratic candidate in Arizona had substantially cut into the lead built up by the Republican candidate with most of the of the uncounted votes in Democratic strongholds. Instead of winning 56 Senate seats a pickup of 5, as seemed likely on Tuesday night, the Republicans gains were cut to no more than 2, and the apparent defeat of an incumbent in the Florida election was thrown into doubt, as late returns showed a steadily shrinking Republican margin, sending Republicans into an almost hysterical panic at the prospect gaining no more than one seat rather than five they had been expecting on Tuesday night.
So, within a day or two after the election, the narrative of a Democratic wave began to reemerge. Many commentators accepted the narrative of a covert Democratic wave, but others disagreed. For example, Sean Trende at Real Clear Politics argues that there really wasn’t a Blue Wave, even though Democratic House gains of nearly 40 seats, taken in isolation, might qualify for that designation. Trende thinks the Democratic losses in the Senate, though not as large as they seemed originally, are inconsistent with a wave election as were Democratic gains in governorships and state legislatures.
However, a pickup of seven governorships, while not spectacular is hardly to be sneezed at, and Democratic gains in state legislative seats would have been substantially greater than they were had it not been for extremely effective gerrymandering that kept democratic gains well below their share of the vote in state legislatures even though their effect on races for the House were fairly minimal. So I think that the best measure of the wave-like character of the 2018 elections is provided by the results for the House of Representatives.
Now the problem with judging whether the House results were a wave or were not a wave is that midterm election results are sensitive to economic conditions, so before you can compare results you need to adjust for how well or poorly the economy was performing. You also need to adjust for how many seats the President’s party has going into the election. The more seats the President’s Party has to defend, the greater its potential loss in the election.
To test this idea, I estimated a simple regression model with the number of seats lost by the President’s party in the midterm elections as the dependent variable and the number of seats held by the President’s party as one independent variable and the ratio of real GDP in the year of the midterm election to real GDP in the year of the previous Presidential election as the other independent variable. One would expect the President’s party to perform better in the midterm elections the higher the ratio of real GDP in the midterm year to real GDP in the year of the previous Presidential election.
My regression equation is thus ΔSeats = C + aSeats + bRGDPratio + ε,
where ΔSeats is the change in the number of seats held by the President’s party after the midterm election, Seats is the number of seats held before the midterm, RGDPratio is the ratio of real GDP in the midterm election year to the real GDP in the previous Presidential election year, C is a constant reflecting the average change in the number of seats of the President’s party in the midterm elections, and a and b are the coefficients reflecting the marginal effect of a change in the corresponding independent variables on the dependent variable, with the other independent variable held constant.
I estimated this equation using data in the 18 midterm elections from 1946 through 2014. The estimated regression equation was the following:
ΔSeats = 24.63 – .26Seats + 184.48RGDPratio
The t values for Seats and RGDPratio are both slightly greater than 2 in absolute value, indicating that they are statistically significant at the 10% level and nearly significant at the 5% level. But given the small number of observations, I wouldn’t put much store on the significance levels except as an indication of plausibility. The assumption that Seats is linearly related to ΔSeats doesn’t seem right, but I haven’t tried alternative specifications. The R-squared and adjusted R-squared statistics are .31 and .22, which seem pretty high.
At any rate when I plotted the predicted changes in the number of seats against the actual number of seats changed in the elections from 1946 to 2018 I came up with the following chart:
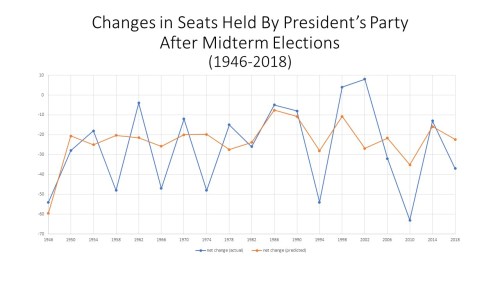
The blue line in the chart represents the actual number of seats gained or lost in each midterm election since 1946 and the orange line represents the change in the number of seats predicted by the model. One can see that the President’s party did substantially better than expected in 1962, 1978, 1998, and 2002 elections, while the President’s party did substantially worse than expected in the 1958, 1966, 1974, 1994, 2006, 2010 and 2018 elections.
In 2018, the Democrats gained approximately 38 seats compared to the 22 seats the model predicted, so the Democrats overperformed by about 16 seats. In 2010 the Republicans gained 63 seats compared to a predicted gain of 35. In 2006, the Democrats gained 32 seats compared to a predicted gain of 22. In 1994 Republicans gained 54 seats compared to a predicted gain of 26 seats. In 1974, Democrats gains 48 seats compared to a predicted gain of 20 seats. In 1966, Republicans gained 47 seats compared to a predicted gain of 26 seats. And in 1958, Democrats gained 48 seats compared to a predicted gain of 20 seats.
So the Democrats in 2018 did not over-perform as much as they did in 1958 and 1974, or as much as the Republicans did in 1966, 1994, and 2010. But the Democrats overperformed by more in 2018 than they did in 2006 when Mrs. Pelosi became Speaker of the House the first time, and actually came close to the Republicans’ overperformance of 1966. So, my tentative conclusion is yes, there was a blue wave in 2018, but it was a light blue wave.

Hi David,
Another enjoyable article. Many thanks from down under.
Down here we much prefer to examine swings to parties and how much a proportion of the vote they gain rather than seats per se’ which can easily be manipulated by gerrymandering for example. A famous example here was in a state election where a party lost the election despite getting 55% of the vote. Thus a landslide meant a loss.
LikeLike
TravisV
LikeLike
Hello David-some fascinating analysis. It actually WAS more than a light blue wave if you go by margin of victory in the popular vote where the Dems won by a larger margin than even the 1974 Watergate Democrats who previously had the largest margin in modern times.
https://www.nbcnews.com/politics/elections/democrats-smash-watergate-record-house-popular-vote-midterms-n940116
Why was their net seat pickups less? You touched on it above-very aggressive GOP gerrymandering after the 2010 census. With a more favorable map they would have picked up more seats. But they are set up much better for the 2020 census
LikeLike
Mike, I agree. With a gain of 41 instead of 38 seats, the Dems overperformed almost as much (+19 seats over predicted) as in the 1966 midterms when the Rs picked up 47 seats (+21 over predicted). In the 1958, 1974, 1994, 2010, the overperformance was even more pronounced (in the high 20s above the predicted gains).
LikeLike
nottrampis, Thank you. Who is in charge of drawing parliamentary districts in Australia? In Britain?
LikeLike